The New VLamax Metric in WKO
by Kolie Moore
The Power Duration Curve
The power duration curve is a tool that gives us insight into an athlete’s performance. My coaching experience tells me the PD curve is a better predictor of performance than any single measure of an athlete’s physiology, such as VO2max, fiber type, sprint power, or, as shall be discussed, VLamax. In other words, as Andy Coggan has stated many times, the best predictor of performance is performance itself. The subtext is that physiologic measurements never give us the entire picture of a whole athlete.
There are still occasions when we may want to gain deeper insight into an athlete’s physiology, since the "to improve power at duration X, always do intervals of duration X" concept has both practical and physiological limitations in its effectiveness. My coaching philosophy holds that understanding such underlying phenomena to maximize adaptation leads to better training decisions for improving the PD curve and other aspects of performance. This means interpreting performance data to see if a training intervention is having the desired effect, and to adjust the training approach if needed.
In a sense, it's redundant to reverse engineer these physiologic and biochemical contributors to power, not only in that they are intertwined, but also in that viewing as a whole through the body of a working athlete results in the PD curve again. Most of these metrics besides FTP (work rate at maximal lactate steady state) are not obvious on the PD curve because of overlap in the contribution of energy systems in our muscles.
Maintaining Equilibrium
Energy supplied to our muscles occurs through ATP hydrolysis to ADP and AMP. The potential energy of ATP is maintained by keeping this reaction many orders of magnitude away from equilibrium. Any sudden energy demand (muscle contraction) results in a rapid narrowing of this ratio that puts a living cell in danger of losing its chemical energy source to maintain function. Fortunately, evolution provided cells with rapidly-responding energy pathways that are activated by things like ADP, AMP, inorganic phosphate ions, calcium, and various other signals. Additional pathways are in place to maintain potential energy of ATP during high demand; they can squeeze out additional ATP from an ADP pool and eliminate AMP from the adenine nucleotide pool. These pathways may keep the concentration of the equilibrium numerators (hydrolysis reaction products ADP and AMP) low to maintain potential energy of ATP.
There are few cellular phosphate reactions with enough potential energy to supply energy to ATP itself. They are critical for performance and function, because without resupply, cellular ATP stores are only sufficient to sustain high demand on the order of seconds, not minutes or even tens of seconds.
The creatine phosphate (PCr) pathway is one of these pathways, which operates at near equilibrium with ATP (note that equilibrium does not necessarily imply a 1:1 ratio of products to reactants). On disturbance of the ATP ratio, meaning ATP concentration falls and AMP rises, PCr acts rapidly to maintain ATP concentration. There is enough energy to supply high demand for several seconds before PCr dwindles, though it never truly runs to zero. Resupply of PCr is provided by the mitochondria, which requires oxygen flux to aerobically produce both ATP and PCr. Because oxygen supply is carefully regulated to only supply what is needed to the muscles, when we transition from a long period of rest or low demand activity, like easy spinning, to high demand activity, such as sprinting, supply of oxygen is generally low. Rate of oxidative ATP and PCr resynthesis is therefore also low.
Going from rest to a full supply of oxygen can take a minute or more. Given this shortcoming in both the oxidative and PCr systems for ATP supply, we rely on glycolysis to meet the remaining demand. Glycolysis is the pathway that takes glucose or glycogen and splits it into two pyruvate or lactate molecules. We net 2 ATP molecules for each molecule of glucose broken down to pyruvate or lactate.
We might be tempted to think that glycolysis is only activated when PCr stores get low, but this is not the case. At the onset of exercise, all of the main pathways of ATP supply are activated as seen in the image below.
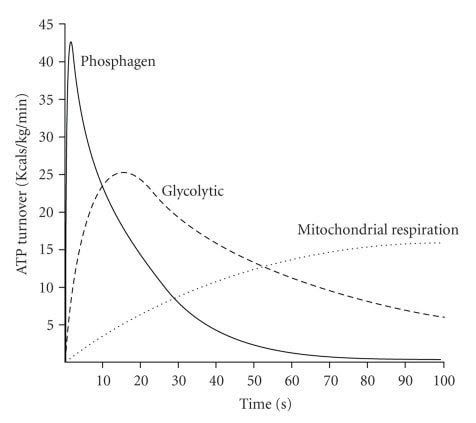
The overall shape of this curve may look familiar, especially if you’ve seen the PD curve on a linear, rather than the usual logarithmic, time scale.
Demand Determines Response
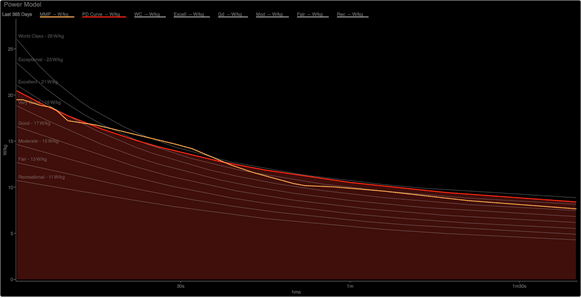
There are two interpretations of the chart above when we compare the relative strength of this athlete's "excellent" 1- to 10-second power to his "world class" power at 30 seconds. The short duration is primarily (but not entirely) supplied by residual ATP stores and PCr. At 30 seconds, the contributor to this demand is primarily (but again, not entirely) glycolysis.
One unfamiliar with the regulation of these energy systems may determine that this athlete’s PCr system isn’t strong enough to supply more sprint power, while his ability to perform glycolysis at 30 seconds is, relatively to his sprint, much stronger. The implication is that the PCr system drives sprint ability, but this is backward. In a similar manner, 30-second power is not driven by glycolytic rate. These are metabolic responses to the imposed demand.
Muscle contraction begins with a nerve impulse that is detected by voltage detectors attached to the sarcoplasmic reticulum, which releases calcium that binds to a protein that is wrapped around the actin filaments of sarcomeres. This protein then moves out of the way of myosin binding sites, which will bind and contract as long as the calcium level is sufficient and the site is exposed. In this way, a contracting muscle fiber is an all-or-none action. Contraction is initiated by the nervous system, and this creates ATP demand. So for this athlete, increasing sprint power can be done by improving neural drive (more rapid force development, recruitment of larger motor units), or building muscle mass (more sarcomeres to contract), and this in turn will increase demand. I would have no worry whatsoever of his metabolism supplying another 100 watts of sprint power.
As previously mentioned, the likely largest cause of reducing sprint power after 8-10 seconds is the depletion of PCr stores and insufficient mitochondrial respiration for resynthesis. Glycolysis is initiated nearly as quickly as the phosphocreatine pathway. Greatly simplified, flux through glycolysis is kept low when the cell’s energy state is high, but in the presence of AMP and a lower cellular energy state, flux is increased in order to meet demand. This occurs regardless of the amount of glycolytic enzymes present, since the amount of ATP produced here is determined by demand. Tight regulation of all metabolism ensures that our energy stores are only tapped into when absolutely necessary.
The Origin of Lactate
Lactate and pyruvate are both partially oxidized glucose, and cells can send them into the blood or move them into the mitochondria to be used in the Krebs cycle. Lactate is an obligatory end product of glycolysis. In fact, at rest, the ratio of lactate to pyruvate is approximately 10:1, and during the most severe exercise can exceed 100:1. This reaction is catalyzed by the enzyme lactate dehydrogenase (LDH).
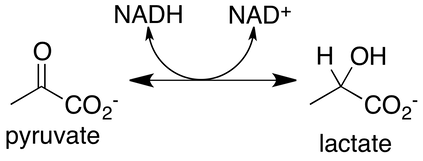
Action of the LDH enzyme is rapid and seems to be entirely unregulated. This means at most times, the ratio of lactate and pyruvate in a cell are considered to be at equilibrium. In the reaction in Figure 3 above, NADH donates hydrogen to pyruvate. This is the critical part of the reaction, since NAD+ is required for glycolysis. The LDH reaction maintains free NAD+ stores in a cell and allows glycolysis to continue. Without this reaction, a muscle with large ATP demands, such as during sprinting, would run out of NAD+ rapidly (several seconds or less) and glycolysis would halt, with the cell falling short of the imposed demands, which would lead to severe dysfunction of muscle contractions.
Because oxidative phosphorylation and PCr resynthesis occur in the mitochondria, with rates limited by oxygen supply, in no way could they keep up with the ATP and PCr resynthesis demands required of high power efforts. Glycolysis fills in for ATP demands when more sustainable pathways are too slow, and this leads to lactate production.
The VLamax Model
With this background knowledge established, we can now investigate the nuances of VLamax, how to measure it, what it can and cannot tell us, and potential sources for error in both measurements and modeling.
The maximum rate, or velocity, of lactate creation is known as VLamax. As discussed above, it occurs through nearly-immediate activation of glycolysis in response to a large and sudden demand of ATP. Determining VLamax is possible from blood lactate samples by measuring blood lactate concentration at rest before a test effort, performing the effort, finishing with pedaling as little as possible, and then measuring blood lactate immediately and every minute after for about 5-8 minutes until the highest value has been established. Then we subtract the pre-test value from the post-test highest value and divide by the duration of the test effort. A change in blood lactate of 7.5 mmol/L over the course of a 15-second sprint yields a VLamax of 0.5 mmol/L/s.
In the scientific literature and in modern field testing, there is a frequently-used VLamax testing protocol using only a 15-second maximal sprint, VLamax can occur at durations as short as 3 or 4 seconds (yes, while PCr stores are still high) or as long as about 30 seconds. My protocol for measurement is a series of maximal efforts to find true VLamax. A single effort protocol of 15 seconds will likely estimate true VLamax about half the time. In my data set, the rate is a little less than 50%, and the effort length that elicits VLamax can change with training and detraining.
Modeling VLamax, therefore, requires not only a sufficient data set with proper testing protocol, but also the incorporation of factors that affect the activation of glycolysis and that can draw on lactate before or after it makes it to the bloodstream. Over the last several months, all of these conditions have been satisfied. However, we will nonetheless continue to grow our data set and refine the model in the future. As it stands now, the model I’ve spent the last several months developing utilizes only power data, so having a sufficiently-fed performance duration model with clean data is a requirement for successful model outputs.
The VLamax model is only valid for cycling power and potentially (though currently unverified) any other exercise mode that consists of concentric muscle contraction, such as rowing. It is likely not valid for most running power meters, due to the additional elastic component of energy release that may also include an isometric component (no associated work output that we can measure). If the elastic component is subtracted from running power output, the VLamax model could be valid in this case, as it would measure the remaining work done metabolically. The Stryd power algorithm may successfully do this, but I reiterate that the VLamax metric has not been verified beyond cycling power.
Plotting the model outputs vs actual measured values has an R2 of 0.95. The range of VLamax values in the model is 0.15 to 1.6 mmol/L/min.
Model Error Sources
Prediction of blood lactate is a difficult task and necessitates several assumptions. In building the model, I used as many variables as necessary but as few as possible, most of which have very small error sources. The lactate meters used for sample collection have an associated error, as do the power meters we use for collecting the data used in the model subsequently.
There is a consistent and potentially large source of error in measuring blood lactate, or anything in the blood measured as a concentration. The units of blood lactate are mmol/L, and plasma volume itself can expand and contract with fitness, adaptation to heat stress, and other circumstances. In an off season, it can detrain rather quickly, which can lead to a higher concentration of measured lactate. So for the same power output between two tests of an individual with the same level of fitness, we would expect the same absolute mmol of lactate to be produced. Indeed, in testing I found this to be highly reproducible.
Let’s look at what happens when we change plasma volume. At rest, if an athlete is at 1mmol/L blood lactate concentration with a blood volume of 5L, the athlete has 5mmol of lactate total in his or her blood. Over the course of training, if this expands to 5.5L, the concentration falls to 5mmol / 5.5L = 0.91mmol/L, which seems negligible. If a test effort results in 15mmol/L blood lactate with a blood volume of 5L, then the total lactate is 75mmol. If this same test is done with 5.5L of blood, the resulting value is 75mmol/5.5L = 13.6mmol/L.
The 10% increase in plasma volume means a 10% reduction in the apparent VLamax, or vice versa with detraining associated plasma volume loss. This is despite no change in the actual amount of lactate produced. Compounded with other sources of error, this makes any measurement of VLamax, or any actual measurement of blood lactate, susceptible to day to day variation. In order to accommodate this, all athletes tested were training consistently for several months. Ideally we would have measured blood volume to predict total lactate, rather than the concentration, which would have greatly reduced plasma volume associated error. Since this testing method is unavailable to most athletes, the model is currently based on data that reflects real-world testing conditions with simple blood lactate values. This means that VLamax field tests are best compared to the VLamax model after the athlete has reached a normal training load rather than fresh off a rest. This in no way impacts the validity and utility of the VLamax model for tracking long-term changes.
Another noteworthy source of potential error is VO2 uptake kinetics. As seen in Figure 1 above and previously discussed, at the onset of maximal exercise, all energy systems are activated. Since mitochondrial oxidative phosphorylation is limited by oxygen transport by the blood, with all other factors being equal, an individual with a more rapid rise in VO2 will be capable of more lactate oxidation in the originating muscle cells, as well as oxidation of imported blood lactate by other tissues. While this fact has been incorporated into the model, it seems to leave no detectable signature on power data, obvious or subtle, and so a standard value for VO2 kinetics was assumed. In field testing, there is also an associated error with the time delay between finishing a test effort and finding peak blood lactate, which was also accounted for in the model.
Blood volume is by far the largest source of error in blood lactate values. However, while VO2 uptake kinetics are more important when it comes to determining glycolytic flux and intracellular lactate oxidation prior to diffusion, the error here is comparatively smaller.
Uses of VLamax
In my opinion, the primary utilization of VLamax in coaching and training is determining the effectiveness of anaerobic capacity and sprint power workouts, because the two primary physiological drivers of VLamax are maximum sprint power and anaerobic capacity. Trainable factors that contribute to sprint power are neural drive and coordination, and absolute strength. These determine the fastest rate of ATP utilization and therefore the appropriate amount of glycolytic flux. Improvements in anaerobic capacity are generally associated with muscle buffering capacity of acidity (from ATP hydrolysis, not lactate production) and other metabolites that inhibit intended function of muscles during maximal efforts. In the same time frame that it takes to nearly maximize anaerobic capacity, that is to say about two months, increasing aerobic capacity and VO2 uptake kinetics will reduce VLamax somewhat. Unfortunately, especially in highly aerobically trained individuals a smaller training response is expected, so aerobic reduction of VLamax would not be expected to match the increase that sprint and anaerobic capacity training can improve it.
Large energy demands -- or perhaps we should say extremely high sprint power -- will cause much more glycolytic flux than lower power efforts. If sprint power increases due to neural drive and muscular coordination, the kJ spent is higher, and therefore ATP demand is higher. There is no change in the muscular metabolism, but this will increase glycolytic flux due to neural factors increasing demand. In this case it is not that the muscle has increased its maximum capacity of glycolytic flux. The true maximal rate of glycolysis, as measured in a lab with ideal conditions, is actually much greater than humans are likely ever capable of accessing, meaning we have a large amount of a built-in reserve capacity in our metabolic pathways, or "headroom."
One must wonder why there exists the need for the VLamax metric to exist at all. We can easily determine changes and improvements in FRC and Pmax from the PD curve quite simply, and with fewer sources of error between the data and a final metric. However, VLamax reflects these relationships and can be used as anyone sees fit. My suggestions are merely that.
Misuses of Vlamax
In the realm of suggestions, I stress that the VLamax model should be used with caution in regard to determining aerobic qualities like FTP. This is because maximal glycolytic flux, and therefore lactate production, is determined by factors that are not related to the state of muscle cells functioning near or below FTP. While FTP, or in this case more precisely the work rate at maximal lactate steady state (MLSSw), does represent a metabolic threshold where the runaway increase in blood lactate is indeed a response to cellular conditions at the time (insufficient ability to meet energy demands via oxidative phosphorylation). However, it is not within the scope of this article to investigate the true nature of MLSS. For now let's only discuss its potential relation to VLamax.
The condition that is often asserted with, for instance, high VLamax, is that the glycolytic pathway is "strong" and capable of producing large amounts of lactate at low intensities. It is assumed that for a given energetic state of a cell (meaning ATP demand), at any intensity, the amounts of AMP, ADP, and other metabolites that activate glycolysis are relatively stable. Therefore, with a steady amount of activated glycolytic enzymes, the amount of glucose used should be stable, therefore lactate flux is too. The logical step from this is that below MLSS most lactate is being oxidized aerobically, whether in the originating muscle fiber or by other working muscles, or tissues such as liver or heart after efflux into the bloodstream. As exercise intensity climbs to MLSS and over, the rate of lactate oxidation reaches a turning point where the lactate oxidation rate decreases despite approaching VO2max.
An implication of this particular understanding of VLamax is that the Krebs cycle would take in carbohydrates preferentially, so fatty acid oxidation is merely a substrate that fills in when glycolysis is not activated enough (as it is on the lowest limb of a sigmoidal kinetic curve). This is supposedly because of the marginally higher efficiency of aerobic carbohydrate oxidation (5.05 kcal/L O2) versus fat oxidation (4.69 kcal/L O2). There is a wealth of data showing none of these implications to be the case. Substrate choice in energy metabolism is inherently flexible, though we will eschew the deepest biochemical details.
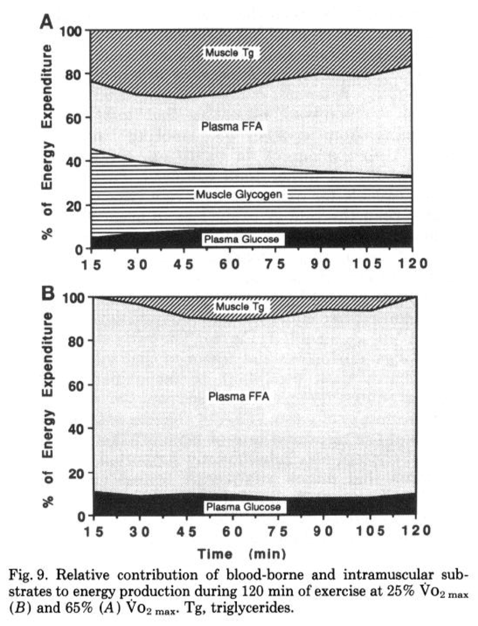
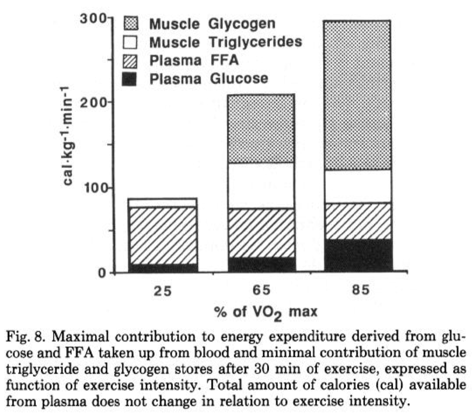
Perhaps most importantly for endurance athletes, fat is a preferred substrate for working muscles when it is readily available. The biggest hurdle of fat oxidation rate is transport, as it must cross several membranes to move from adipose tissue to exercising muscle, but only after systemic hormonal response is established (assuming low or average dietary fats). In an evolutionary sense this is the most logical, as obligately burning carbohydrates for a given ATP demand means metabolism is inflexible, and requires the body draw on its relatively limited carbohydrate stores–even at low intensities or with low stores–rather than fat stores, which are an energy reservoir more than an order of magnitude larger than energy stored as carbohydrate. During submaximal efforts, fatty acids become more available in the bloodstream and utilized by working muscles, and this reduces the required energy from glucose, glycogen, and intramuscular triglycerides. This can be seen in Figure 4 below. Increase of plasma free fatty acid (FFA) oxidation even spares intramuscular triacylglycerides (Tg).
Another implication of assuming VLamax increases glycolysis at lower intensities is that at MLSS, the lactate or pyruvate being produced has overwhelmed the influx mechanism of the Krebs cycle (creation of acetyl-CoA), which would mean that substrate use at FTP is entirely carbohydrates. This is not the case, as what seems to primarily determine fat oxidation is mobilization and transport, in that a greater ATP demand than fat oxidation rates can support will be supplemented with glycolysis. The mechanisms by which carbohydrate oxidation can impede long chain fatty acid transport into the mitochondria is well known, but in our case it is not the malonyl-CoA pathway seen during rest since AMPK is active during exercise and inhibits acetyl-CoA carboxylase. During periods of high pyruvate oxidation, carnitine becomes acetylcarnitine to buffer the small coenzyme A pool, or sufficiently rapid flux of acetyl moieties into the Krebs cycle would halt. The reciprocal mechanism of fat inhibition of carbohydrate is under some controversy, though it may well be as simple as the energy state of the cell (ATP, ADP, AMP concentrations, NAD+/NADH redox state, or both).
In the scientific literature, as well as gas exchange testing of athletes, fat oxidation at FTP can be as much as 2/3, or RER=0.8. Figure 5 below is a typical example that can be found in the scientific literature. Since 85% VO2max is a relatively high value for the relationship of FTP with VO2max, it is reasonable to assume it is approximately FTP or slightly above in a highly trained athlete. We see approximately 1/3 of the athlete’s energy is coming from fat, which corresponds to an RER of approximately 0.9.
According to interpretation that VLamax determines lactate formation and therefore MLSS, manipulation of the maximal glycolytic rate -- which is itself a pathway that only responds to demand and does not create any sort of "metabolic pressure" -- is sufficient to change the value at which FTP or MLSS occurs. This would be the driving force by which lactate production supposedly overcomes aerobic oxidation capacity. Nutritional manipulations such as ketogenic or LCHF diets decrease the amount of lactate flux an athlete is capable of producing by making fatty acids much more available than in an average athlete’s high carbohydrate diet. We would expect to see a significant increase in FTP due to less lactate production, and yet they do not raise FTP. The lactate dynamics at and over MLSS remain as expected regardless of which substrates are utilized.
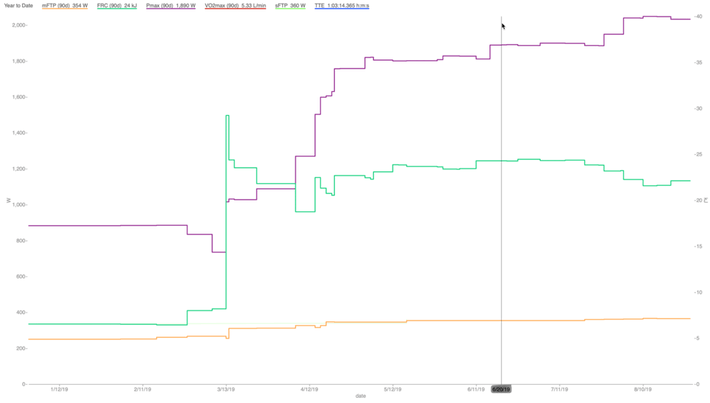
In a very practical sense, we can see increases in measured VLamax as determined by improvement in Pmax and FRC, but without any impact on lowering FTP. Figure 6 below is an example from a criterium racer. Serious training began in February with an endurance and FTP focus. Around May we began to incorporate training to improve his sprint and anaerobic capacity. His Pmax improved from about 1500 watts to nearly 1900 watts, and his FRC improved from about 18 kilojoules to 24 kilojoules, without any decrease in FTP. His VLamax in April was 0.54 mmol/L/min, and for his peak races in June it was 0.76 mmol/L/min. His FTP improved from 325 watts to about 360 watts before we shifted our focus to peak and anaerobic power, and during this training his FTP did not fall, while his VLamax increased substantially.
Conculsion
This article summarizes the physiologic underpinnings of VLamax and its potential use cases. Despite being the author of this VLamax model, I cannot determine the ways in which people will use it to augment their training philosophy, and I'm looking forward to seeing how others find it useful. Many thanks to Javier Sola, Raul Celdran, and their athletes for the time, effort, and blood used to create the model. Thanks also to the athletes I tested myself and for the same in the future as we continue to gather data.