
Charts and Reports
WKO displays data through charts and reports. Many powerful charts and reports are built into the software, plus you can build your own, allowing for an infinite number of ways to customize and view your data. Each chart shown on a dashboard can be edited, expanded, moved, and/or resized on the dashboard.
Learn More
- How To: Expand a Chart
- How To: Edit a Chart
- How To: Create a New Chart
- How To: Import and Export a Chart
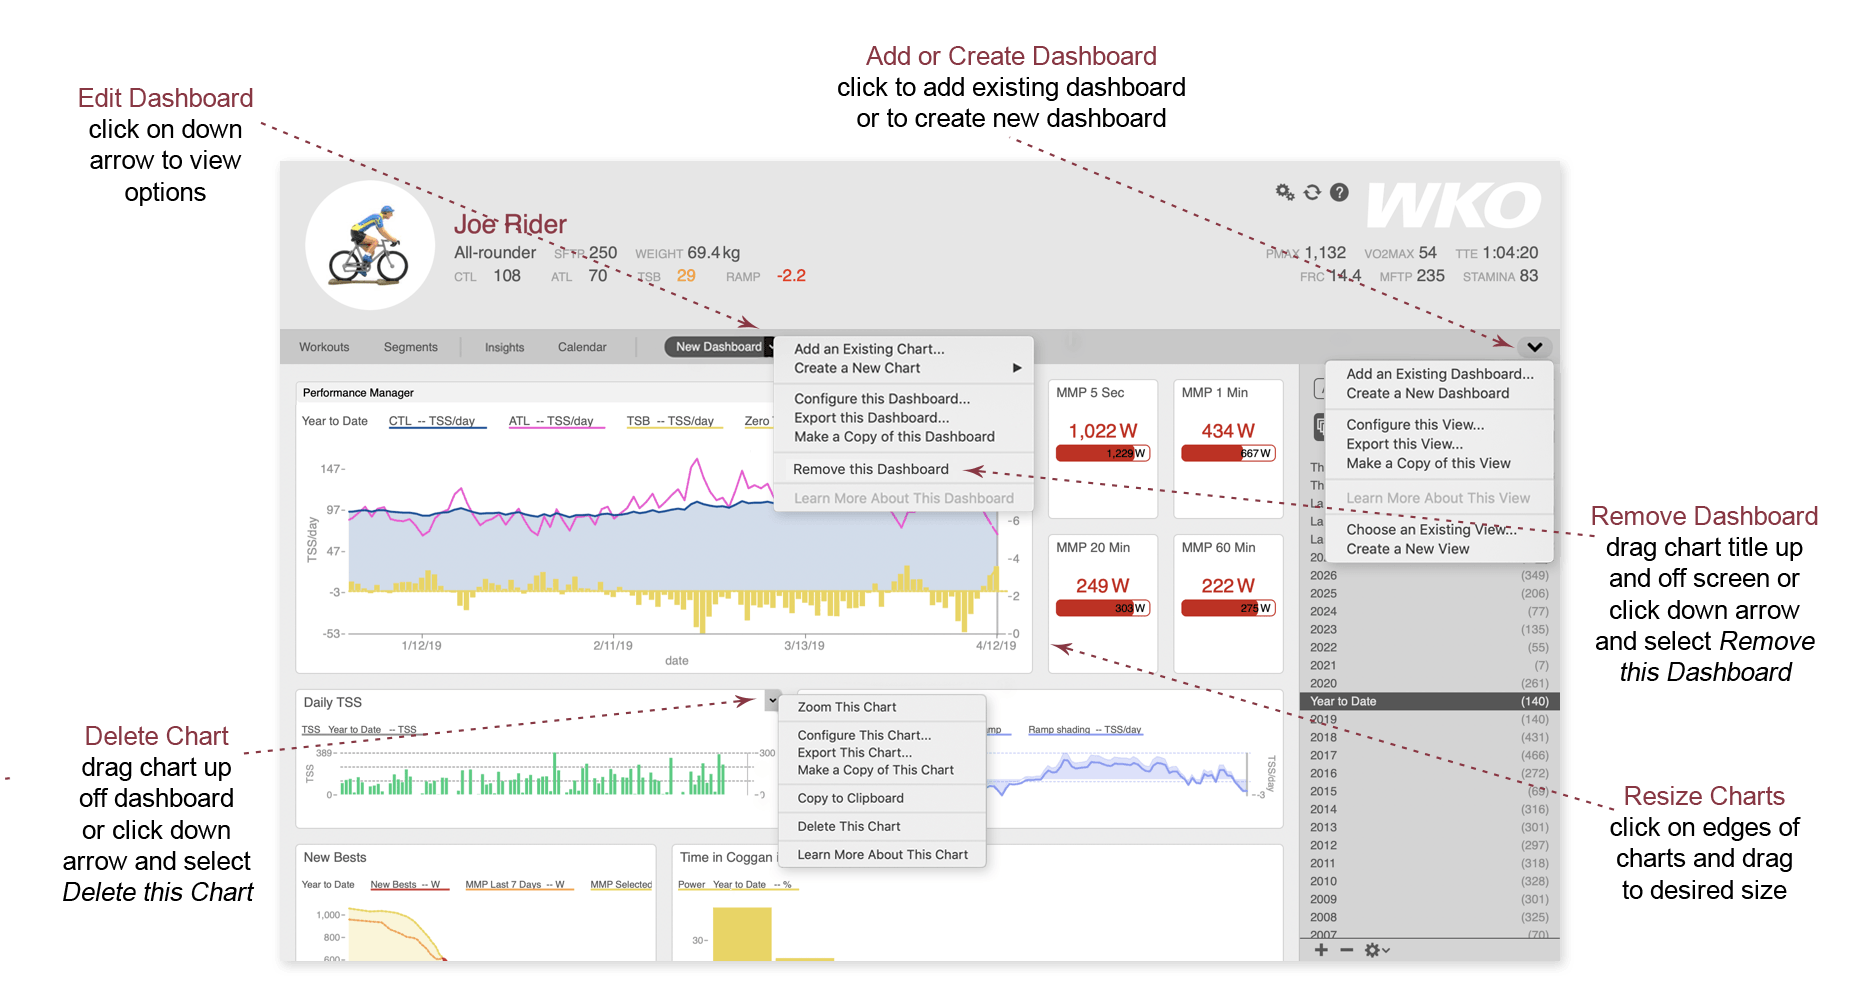
Dashboards
Charts and reports are collected and displayed in dashboards. There are many important dashboards provided in WKO, and you can build and customize as many dashboards as you like. All changes you make to a dashboard are saved automatically.
Learn More
- How To: Add a dashboard
- How To: Create a new dashboard
- How To: Delete a dashboard
- How To: Import and export a dashboard
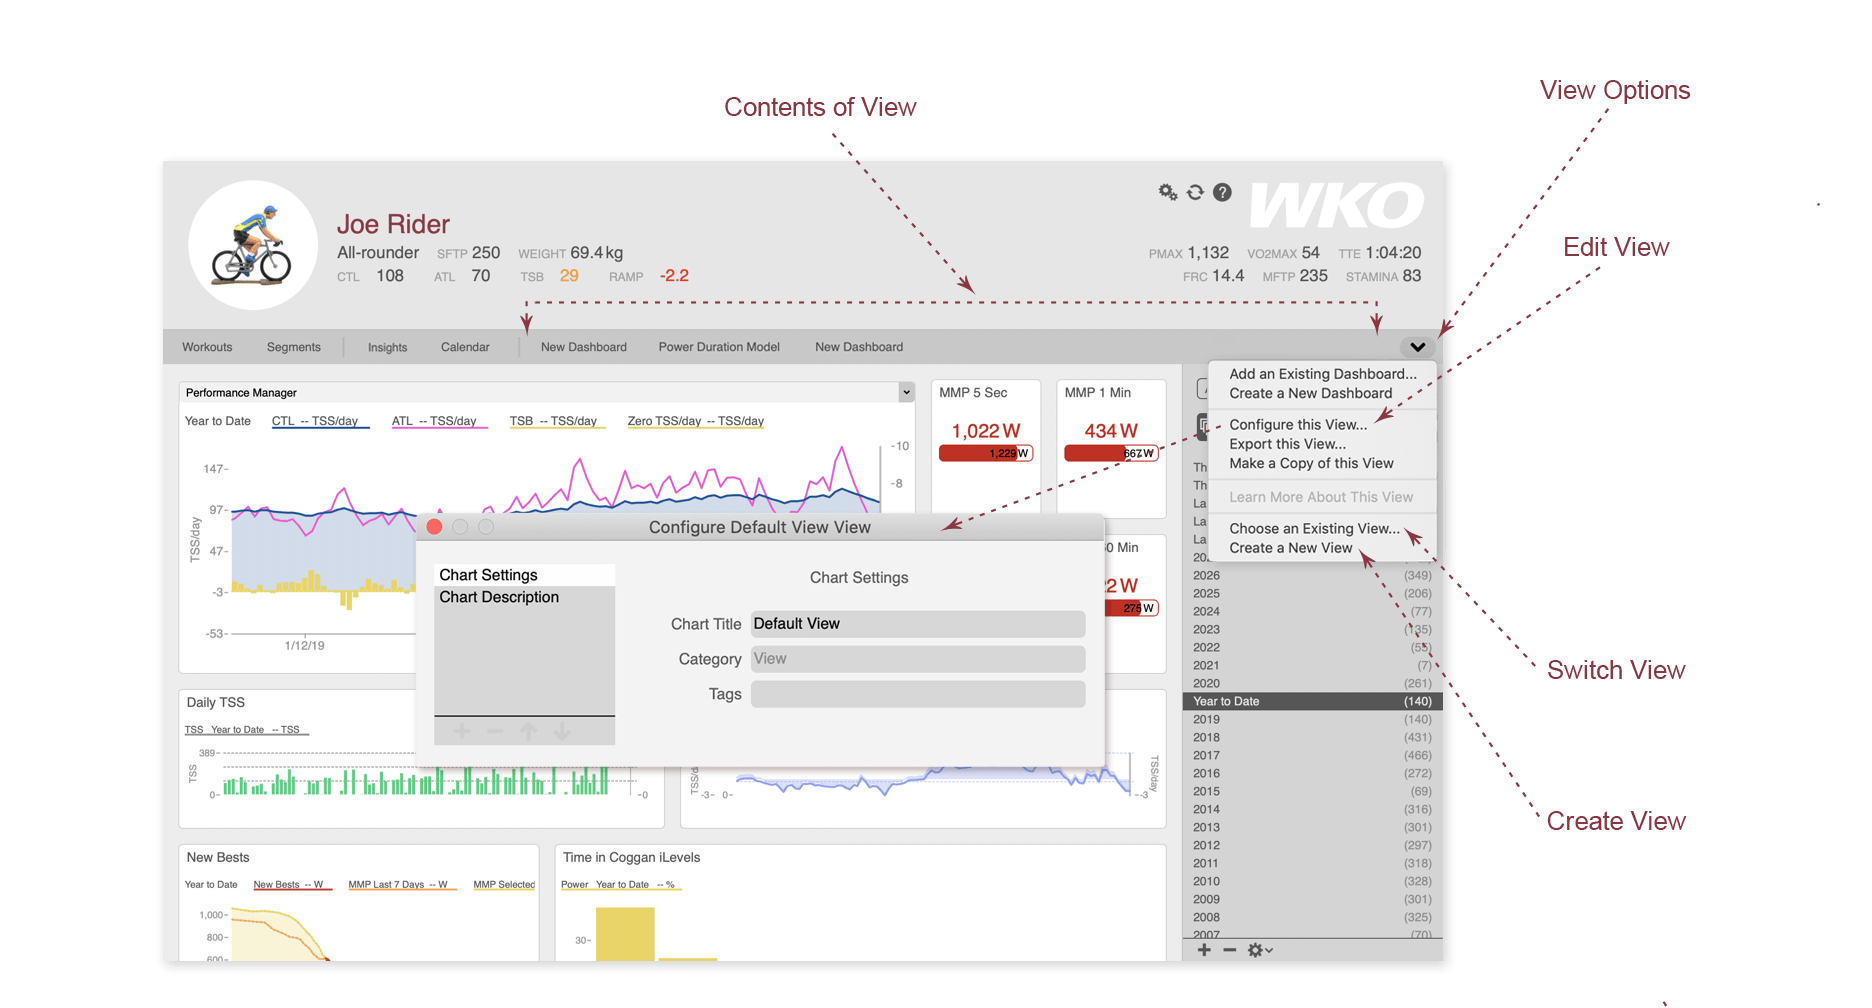
Views
Just as charts and reports are housed in dashboards, the dashboards contained on the navigation bar are stored in a collection called a view. A view can be opened for all athletes or just one, which means you can build unique views (collections of dashboards) and then select a view as desired for each athlete. A common use for views is to display different dashboards for athletes of different sports; for example, you may want a view for run athletes and a different view for triathlete or cycling athletes.
Learn More
- How To: Edit a view
- How To: Switch to a different view
- How To: Create a new view
- How To: Import and export views
- How To: Delete a view