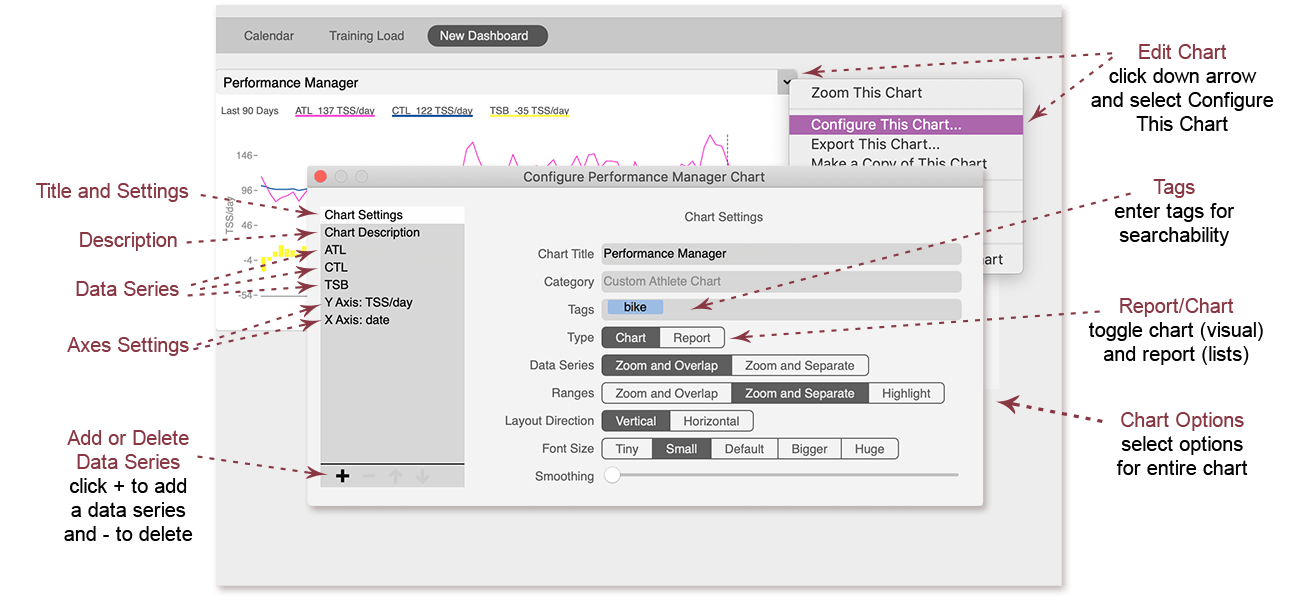
How to edit a chart
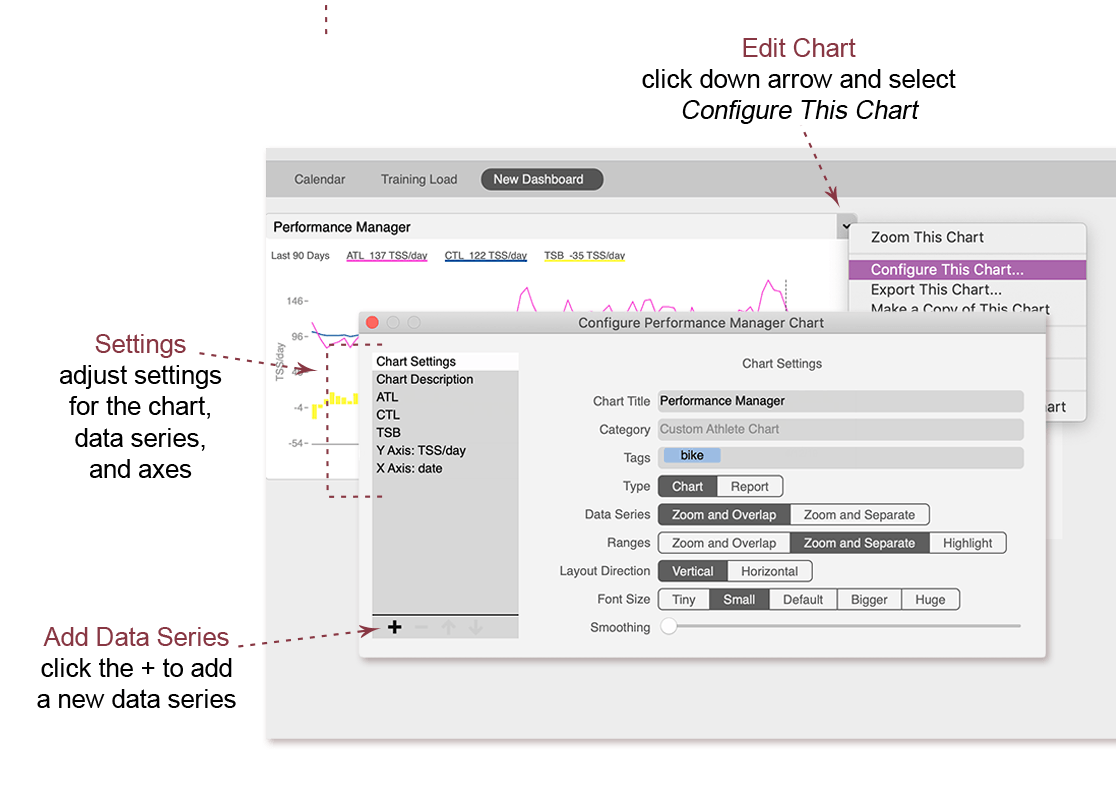
WKO includes many powerful charts that can be customized to your needs. To edit a chart, click the down arrow in the chart title and select Configure This Chart.
How to add a new data series to a chart
- Click the down arrow in the chart title and select Configure This Chart.
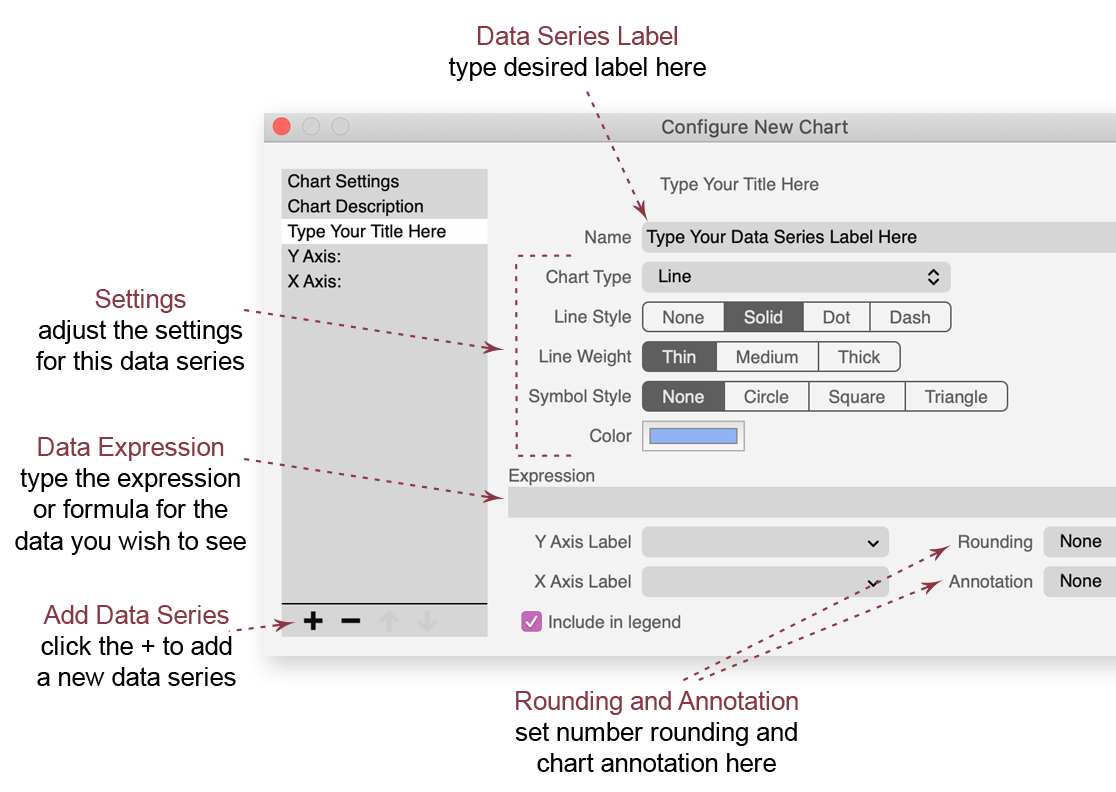
- Click the + at the bottom left of the configuration window to add a data series.
- Enter a label for the data series.
- Enter the expression for the data you wish to display.
- Select the desired settings for the data series. (Available settings are different for charts and reports.)
How to delete a data series from a chart
- Click the down arrow in the chart title and select Configure This Chart.
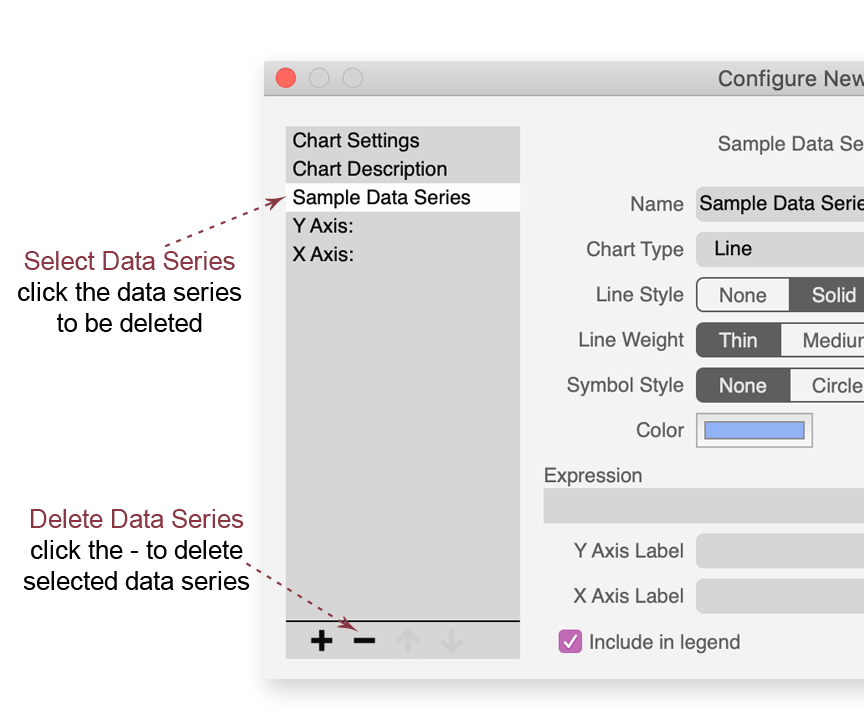
- Click on the data series to be deleted.
- Click the - at the bottom left of the configuration window to remove the selected data series.
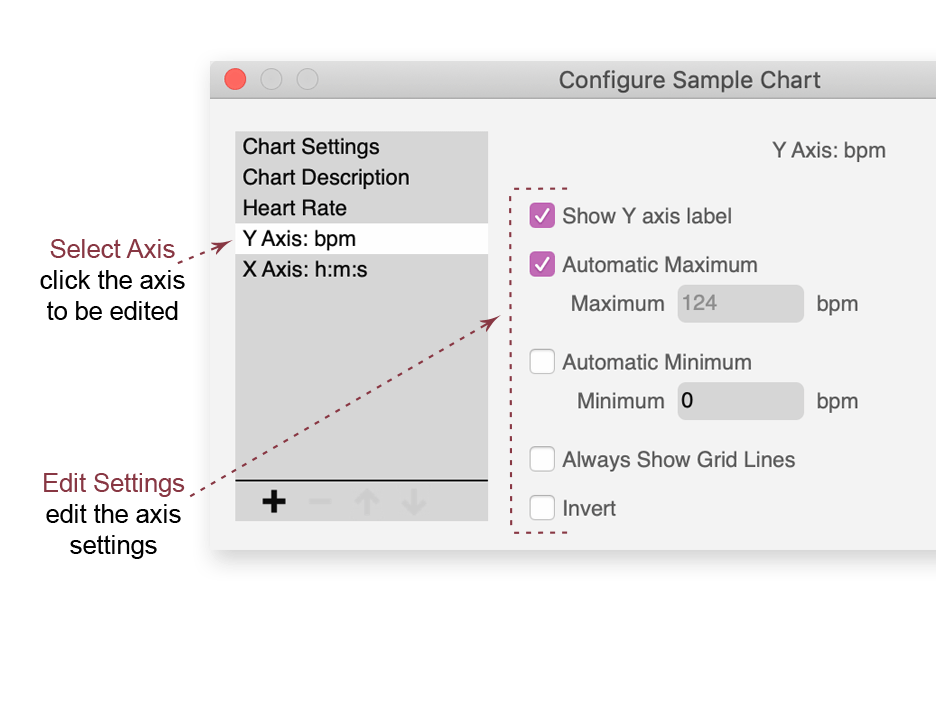
How to edit a Y axis on a chart
- Click the down arrow in the chart title and select Configure This Chart.
- Click the Y axis to be edited.
- Select or modify the options desired.
Axis Options
- Choose whether to display the Y axis label on the chart.
- Set the maximum maximum and minimum to be determined automatically by the actual data or to display a specific range.
- Choose whether grid lines always display on the chart.
- Invert (reverse) the axis.
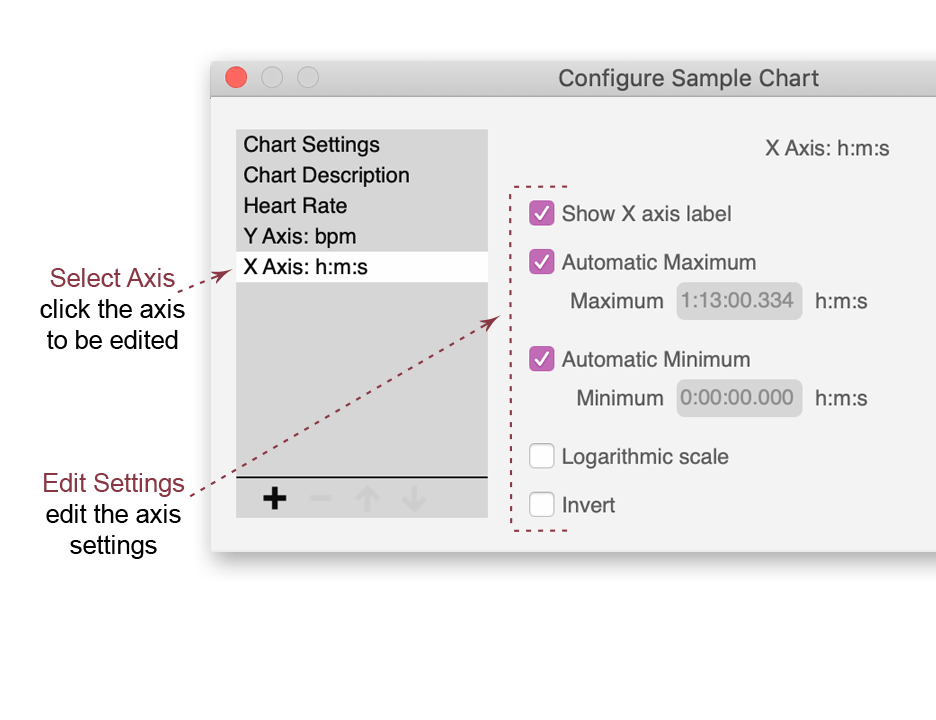
How to edit an X axis on a chart
- Click the down arrow in the chart title and select Configure This Chart.
- Click on the X axis to be edited.
- Select or modify the desired options.
Axis Options
- Choose whether to display the X axis label on the chart.
- Set the maximum maximum and minimum to be determined automatically by the actual data or to display a specific range.
- Change the X axis to be logarithmic.
- Invert (reverse) the axis.