WKO Case Study: Targeting Specific Improvements with the Power-Duration Curve
Coach Richard Rollinson, owner of CPT Cycling
in Reading, England, shares his processes for targeting specific power-duration improvements for his athletes. Links to his custom WKO5 chart dashboards are included.
Training targets based on your unique power-duration curve offer individualized training that work on your own personal strengths and limiters, based on what you have recently achieved from the duration that each planned interval targets. For example, with the power-duration model, anaerobic planned intervals are prescribed relative to recent anaerobic power bests, instead of being based on a percentage of set FTP. Interval targets may be maximal or submaximal. The first one covered in this article is maximal, in the form of a series of tests.
Why Test?
If you aren’t pushing beyond your current maximum power durations, you will not improve, and when a given peak in your power duration falls out of the last 90-day range, your second-best given power duration will then be your new, lower 90-day best. When you achieve a new 90-day power-duration best, you will raise your curve at that point and the surrounding points.
To make it simple to plan a series of power-duration curve (PDC) test workouts, I created a WKO5 dashboard called Targets that I will be using in this case study. You can download the dashboard here. Please note that in order to use this dashboard, the athlete will need at least three months of training data in WKO.
To maximize your power-duration potential and cover your relative strengths and limiters as much as possible, it is most effective to target three distinct power durations for testing. The first one to identify is a short test target. To find your short test target, identify your lowest mean maximal power (MMP) output between 1 second and 30 seconds.
I use the Normalized Residuals chart in my Targets dashboard (as seen in the screenshot below) to find the lowest MMP in comparison to the athlete’s power-duration curve in this time range.
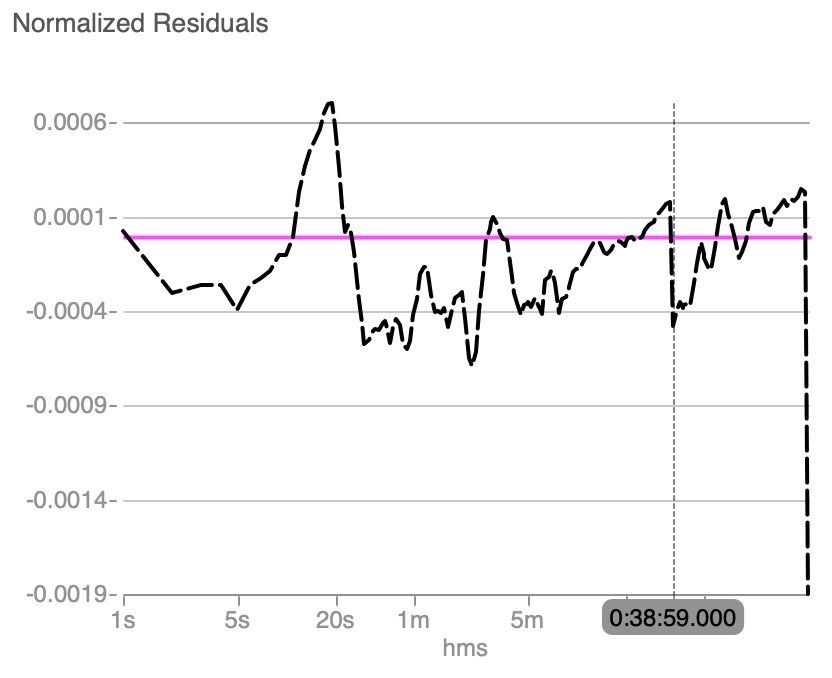
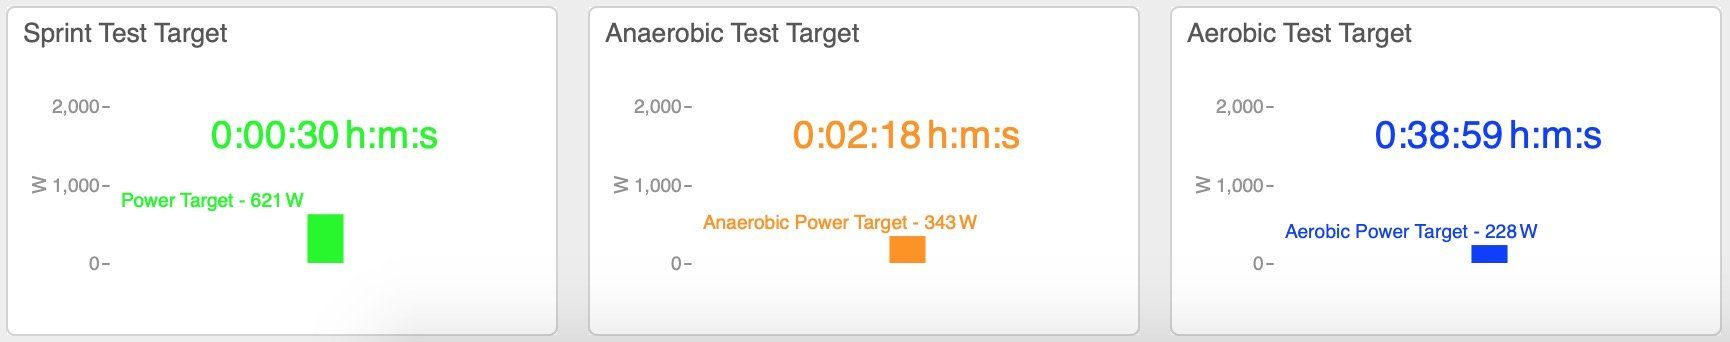
My Targets dashboard also includes three Test Target charts; the lowest points of the Normalized Residuals chart between 1 and 30 seconds should match the target duration seen on the Test Target charts.
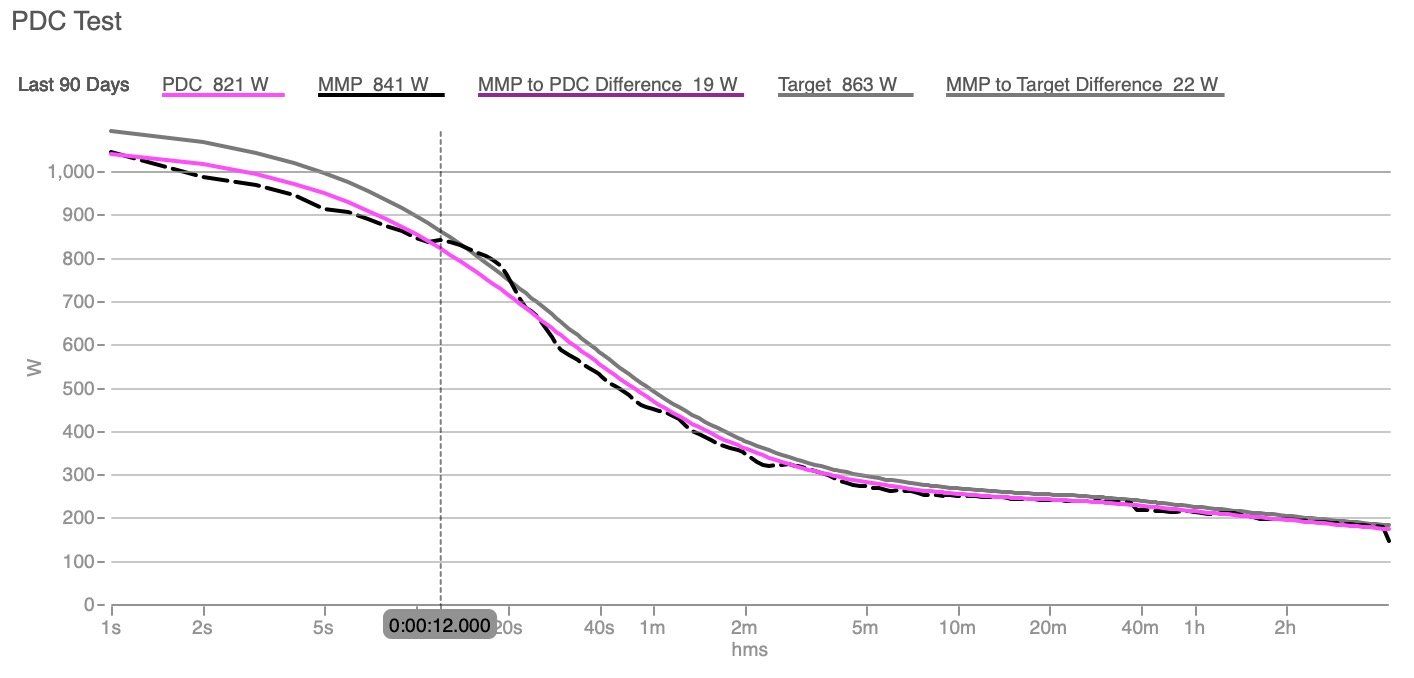
To target a significant power improvement within your grasp, pick the identified target duration and then target power about 5% above the current curve to make a power-duration improvement. The PDC Test chart on the Targets dashboard includes a target curve set at 5% higher than the current curve on all power durations, and the difference between that curve and the current MMP curve is tracked in the legend at the top of the chart. If there is a significantly big enough difference between these two curves, you may need to consider a lower target power.
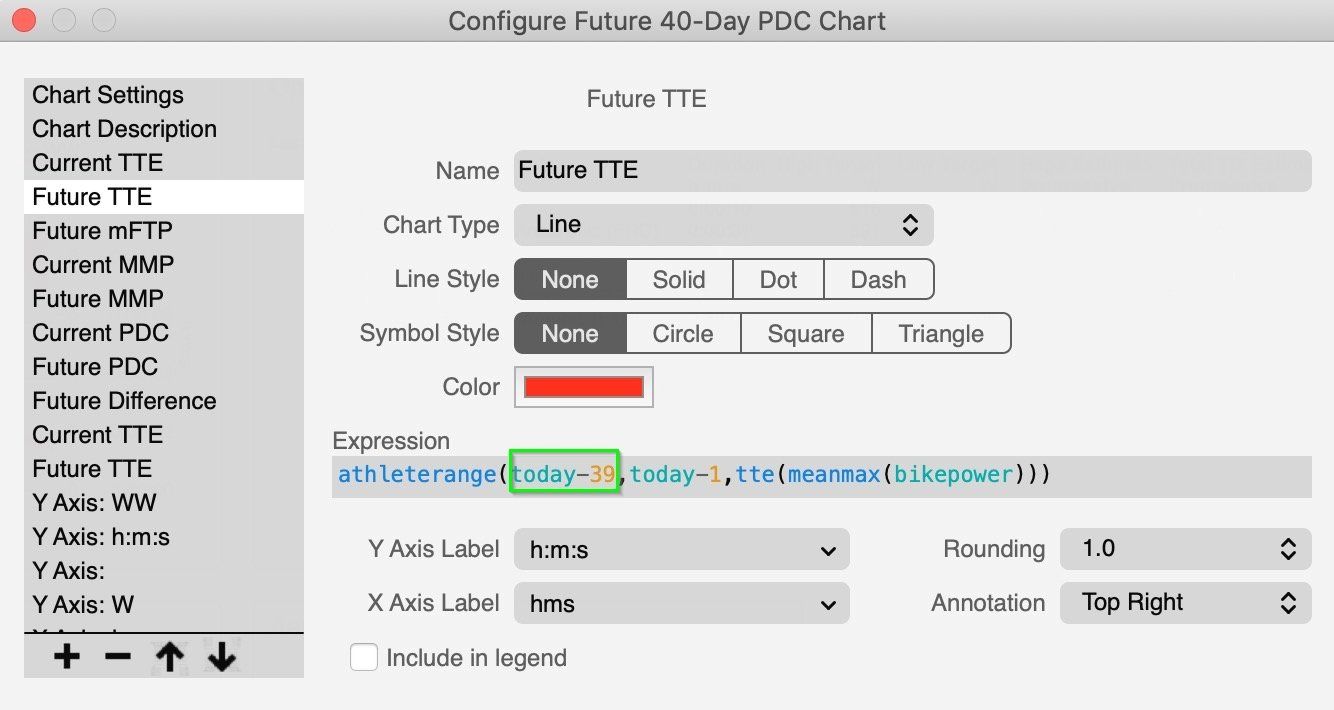
If there are days or even weeks between the day you add the test targets to your training calendar and when you go out and do the test; it is worth checking the Future 40-Day PDC chart on the Targets dashboard to see if you have any power durations that are due to fall outside of the last 90 days in the near future. If the Test Target charts’ duration difference to the power-duration curve is less than the MMP future losses, choose the future loss duration and use the target power for that same duration in the PDC Test chart.
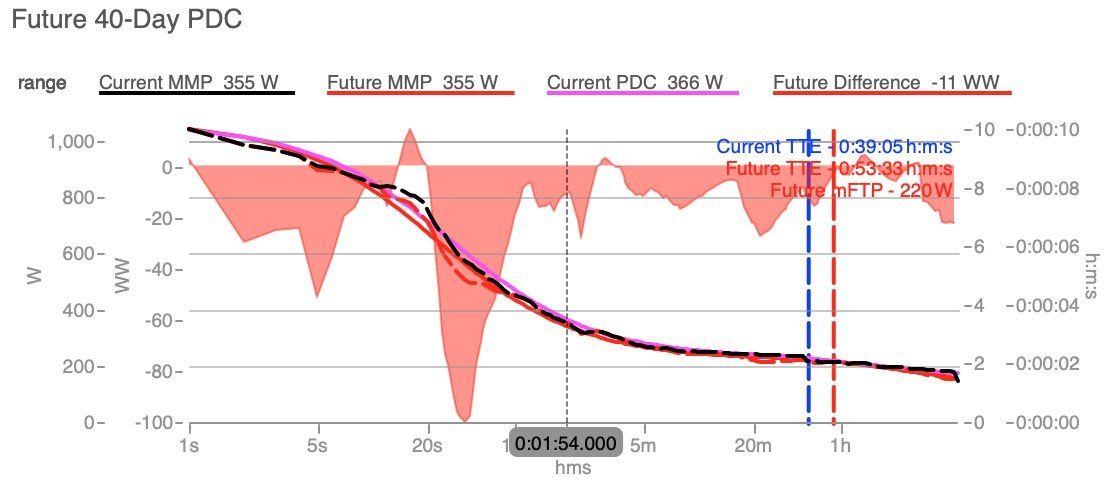
You can modify this chart based on how far into the future your next test will be by changing the expression for any data series with “future” in its name to the amount of days ahead your next test will be.
Repeat the same process for the medium (between 30 seconds and 15 minutes) and long tests (between 15 minutes to 1 hour).
Remember that all 90-day power-duration bests (not just those achieved in test workouts) contribute to your power-duration curve, and they all contribute to WKO’s modeled metrics that affect your power zones, including the following:
- Pmax (maximum sprint power)
- Functional Reserve (Anaerobic) Capacity (FRC)
- FTP (Functional Threshold Power)
- Time to Exhaustion (TTE), your FTP duration
- Stamina (the rate of dropoff in power durations longer than FTP)
This covers most maximal power durations; now let’s look at submaximal.
Why Train Submaximally?
Why would you not train at maximal intensity all the time? While this is certainly possible in the short term, you will hit a non-sustainable limit in a few short weeks and have to take unplanned recovery in order to build again. If you train below your maximum, but close to it, you can ride long term sustainably with planned recovery to train effectively toward being in range of improving maximally on planned tests every 4-6 weeks and on unstructured rides and races between.
One form of submaximal training that many cyclists and coaches are familiar with is the Sweet Spot power zone just below FTP. The same training principles can apply to the rest of your power-duration curve. Based on this are a variety of intervals called Optimized Intervals.
Setting Optimized Intervals Targets
WKO’s Optimized Intervals are designed to give you the most benefit from your training toward each target energy system, individualized to your current fitness in your power-duration curve. Use the Optimized Intervals chart in WKO to find your optimal interval targets for:
- Maximum sprint power
- Anaerobic
- Max aerobic
- Aerobic
The aim for training each energy system will be different, depending on whether you aim to increase power (the intensive training principle) or to increase the duration of current power (the extensive training principle). Max aerobic focuses on building the foundations to increase VO2max.
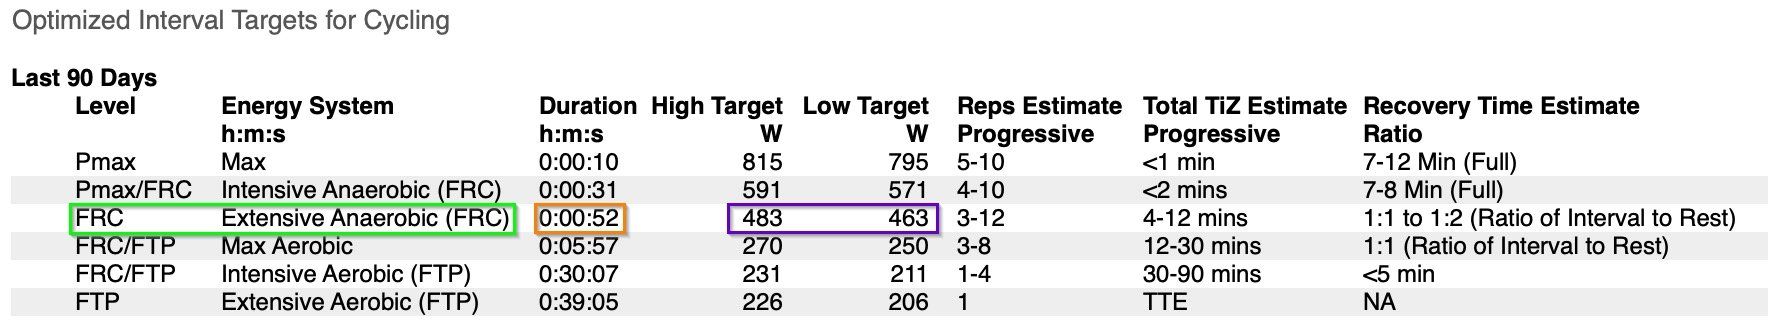
The Optimized Intervals chart uses your training from the last 90 days to identify your training targets. In the screenshot below, you will see in the green box the athlete’s extensive anaerobic targets. The target duration is highlighted in the orange box, and the high and low power targets are shown in the purple box.
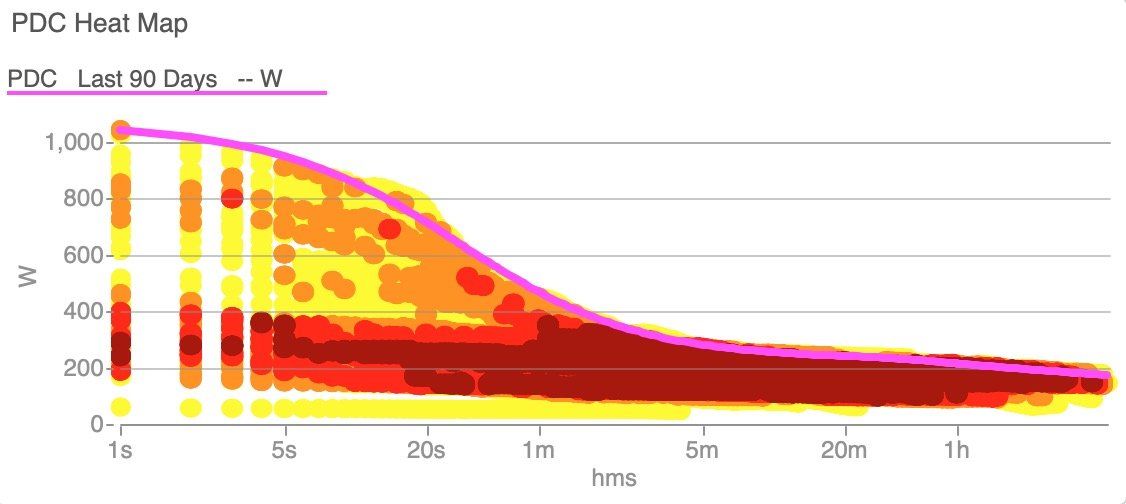
The more regularly you train each energy system and training principle, the greater your chances are of improving your power-duration curve. I track this with the PDC Heat Map chart in my PDC-MMP dashboard, which you can
download here. This dashboard also contains charts that track recent bests and 90-day losses. The PDC Heat Map plots every power duration trained, whether maximal or below, within the date range selected in the RHE.
Planning and tracking in these ways will enable you to identify where you most need to improve to accomplish your goals and adjust your training based on actual completed values.
About TrainingPeaks WKO
WKO is a power data analytics engine built to unlock the secrets of your endurance training and performance data. Click here
for more information and to download your free trial of WKO today.