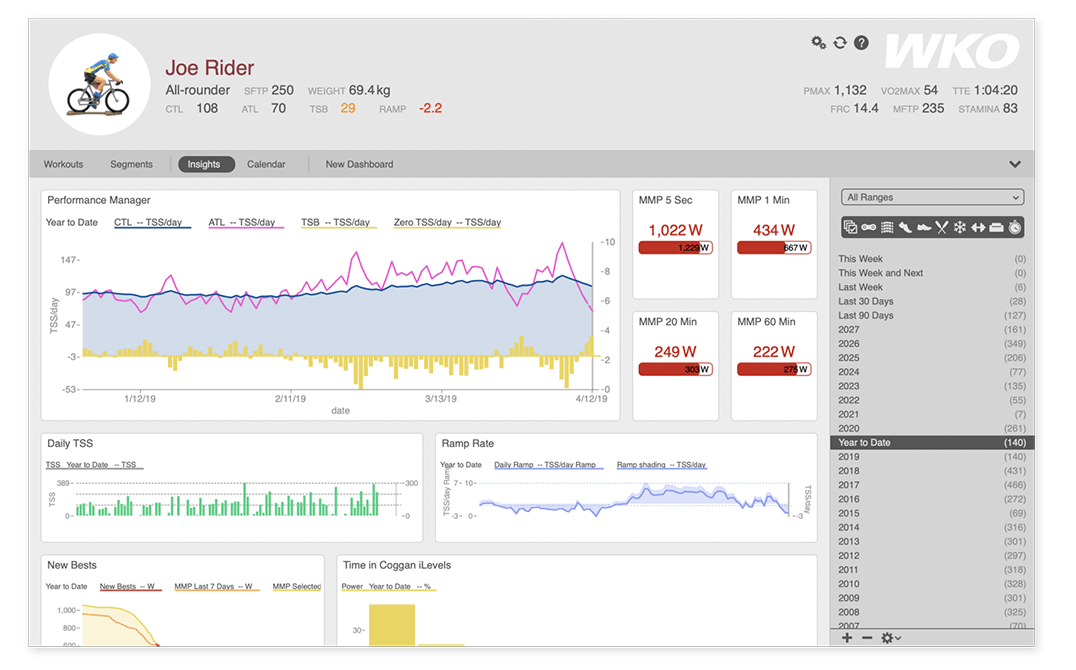
Athlete chart types
Athlete charts are those viewed for an athlete in general rather than for a specific workout. When viewing athlete charts, you will have a list of date ranges and sport types in the RHE (right-hand explorer).
Scroll down or click to view workout chart types.
Click here to learn how to create a chart.
Click here for an overview of the options and settins available for charts.
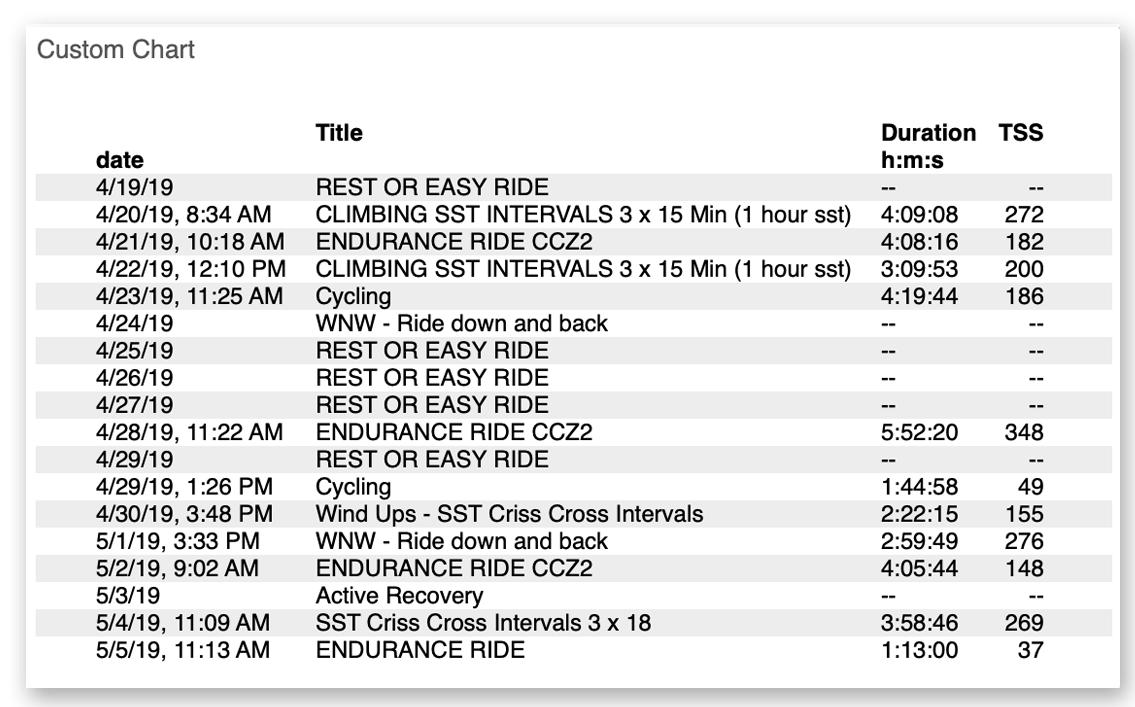
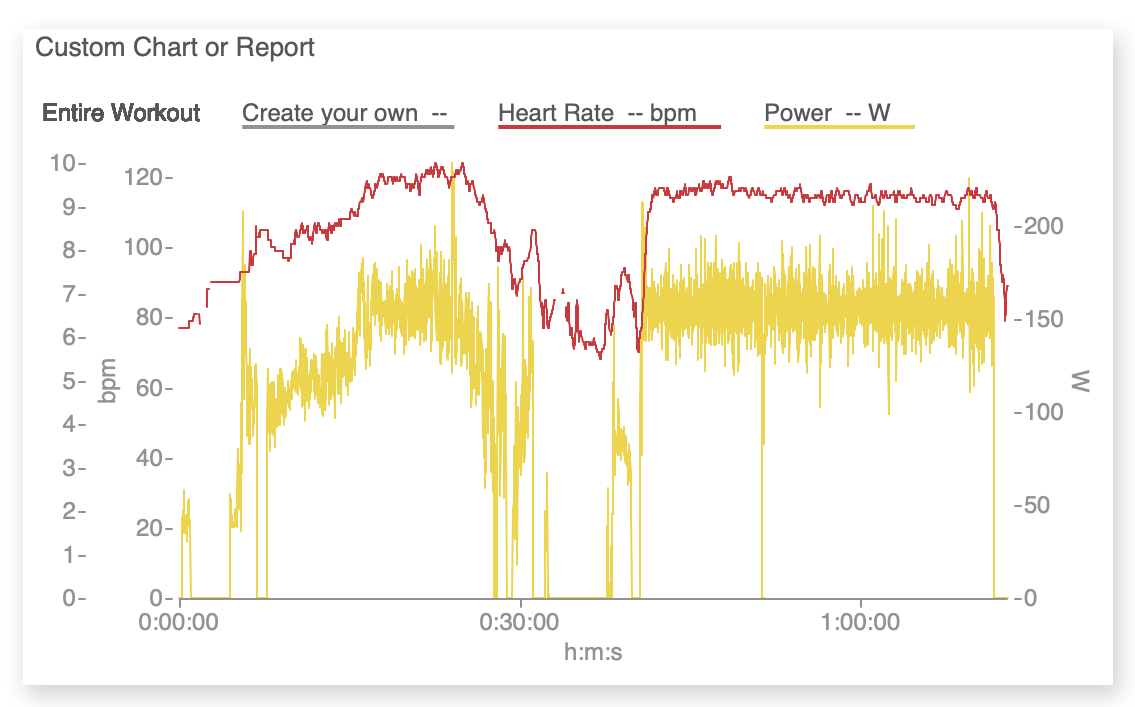
Custom athlete charts
A custom chart starts completely blank. You get to choose the data you want to see and how you want to see it. You can display data as a report (shown here) for a list of data or as a chart for a visual display.
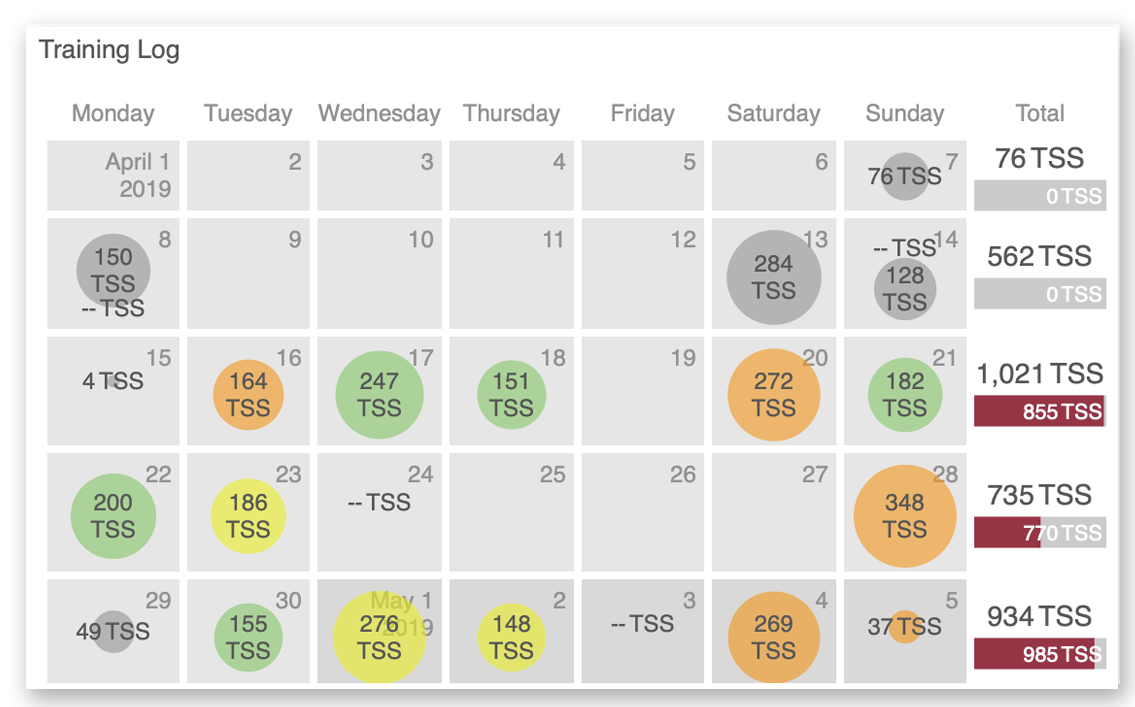
Training log chart
The training log chart is a calendar view of your workouts, with a configurable weekly summary. Use this chart as a visual overview of your training.
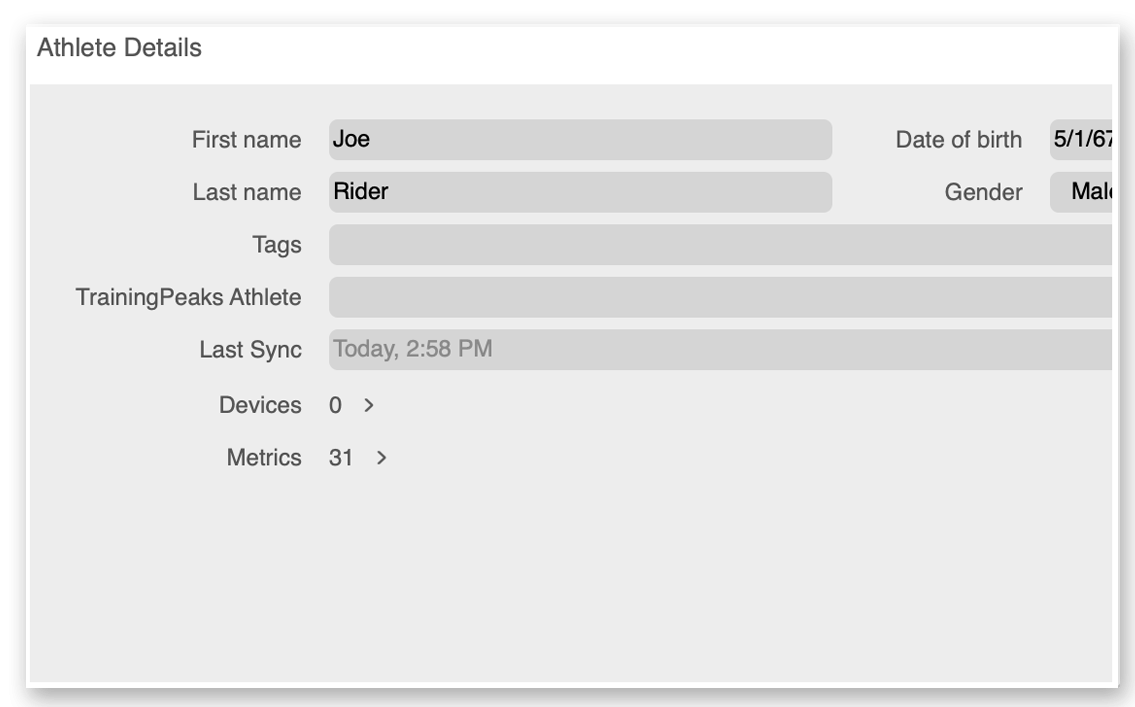
Athlete details chart
The athlete details chart is a copy of the details page that is displayed when you click an athlete's name. Use this chart to edit athlete information, set up TrainingPeaks sync, view devices associated with the athlete, and manage athlete metrics.
Webpage chart
The webpage chart displays the webpage of your choice. Use this chart to view Internet information in real time.
Workout chart types
Workout charts are those viewed for a particular workout rather than for the athlete's training in general. When viewing workout charts, you will have a list of workout time ranges in the RHE (right-hand explorer).
Scroll up or click to view athlete chart types.
Click here to learn how to create a chart.
Click here for an overview of the options and settings available for charts.
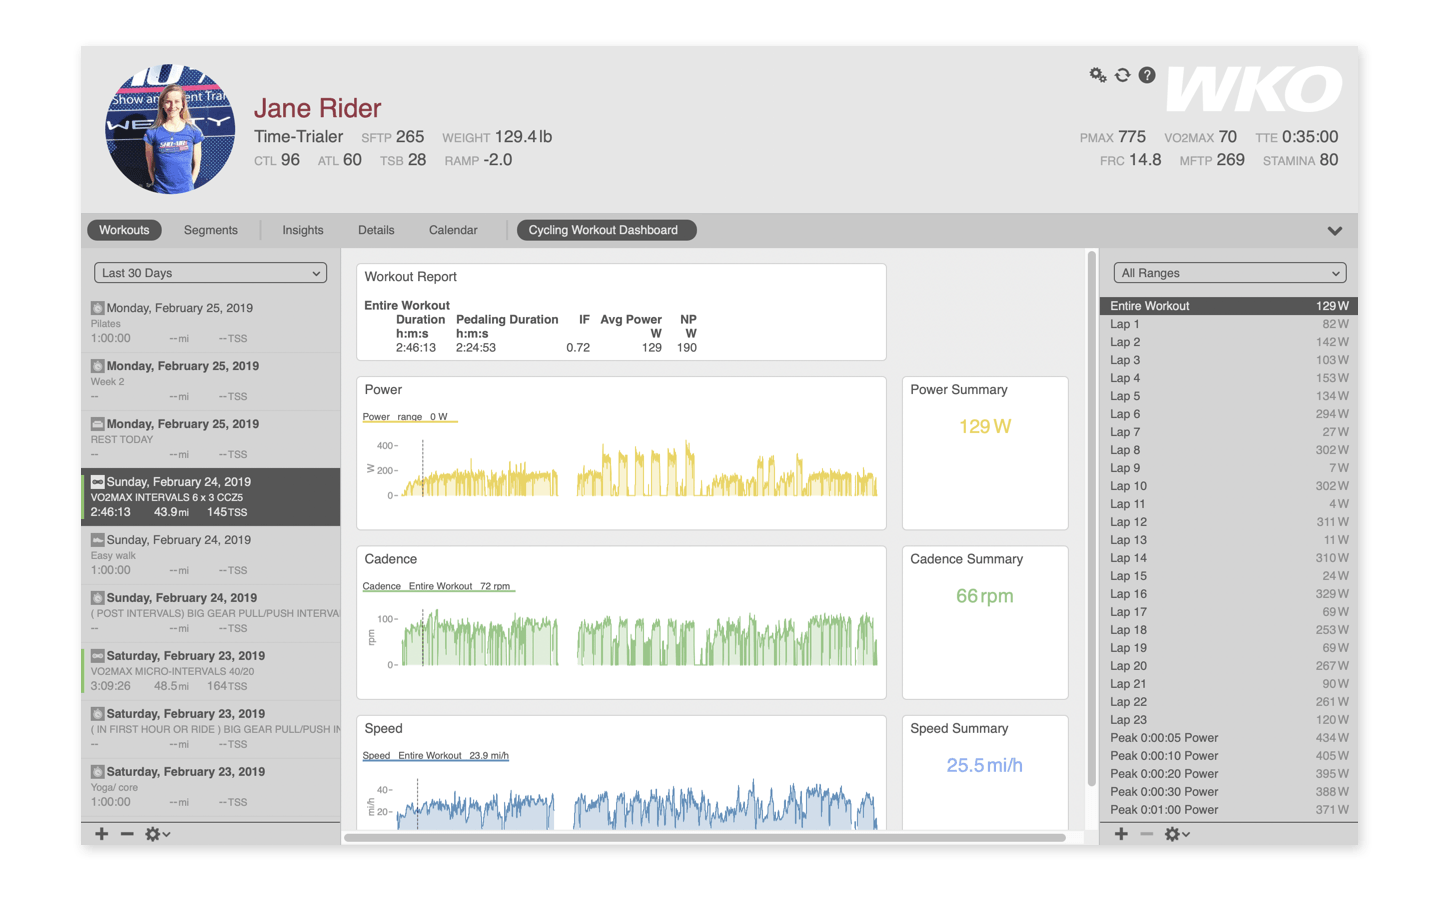
Custom workout charts
A custom chart starts completely blank. You get to choose the data you want to see and how you want to see it. You can display data as a report for a list of data or as a chart (shown here) for a visual display.
Stacked chart
The stacked chart displays all data channels in a workout spread out over multiple rows to give you a detailed view of the workout data. Use this chart to review data line by line.
Note: This chart type is not yet functional.
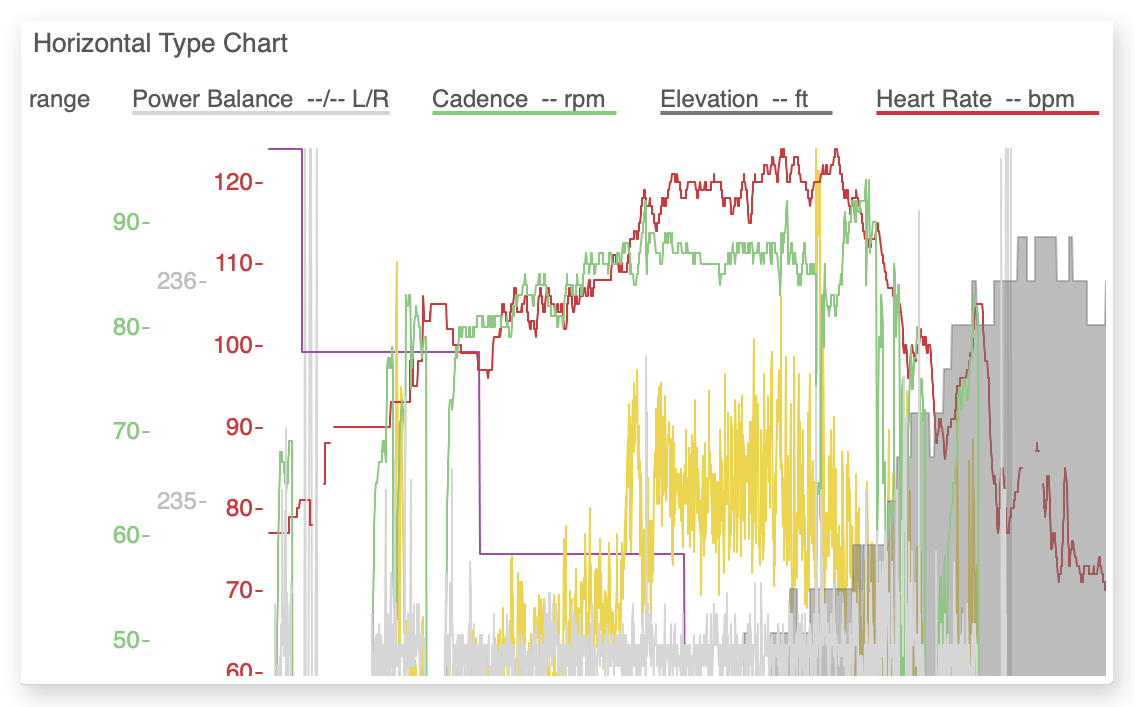
Horizontal chart
WKO's horizontal chart type displays all data channels for the entire workout. It shows the entire workout by default, and selected laps or ranges in the RHE (right-hand explorer) will be highlighted on the chart. Use this chart type to view all workout data at once.
- Hide any data series you don't wish to see by clicking the data series label on the chart and selecting Hide.
- Remove a data series label from the chart legend by opening the chart configuration window, selecting the data series, and unticking the box next to Include in legend.
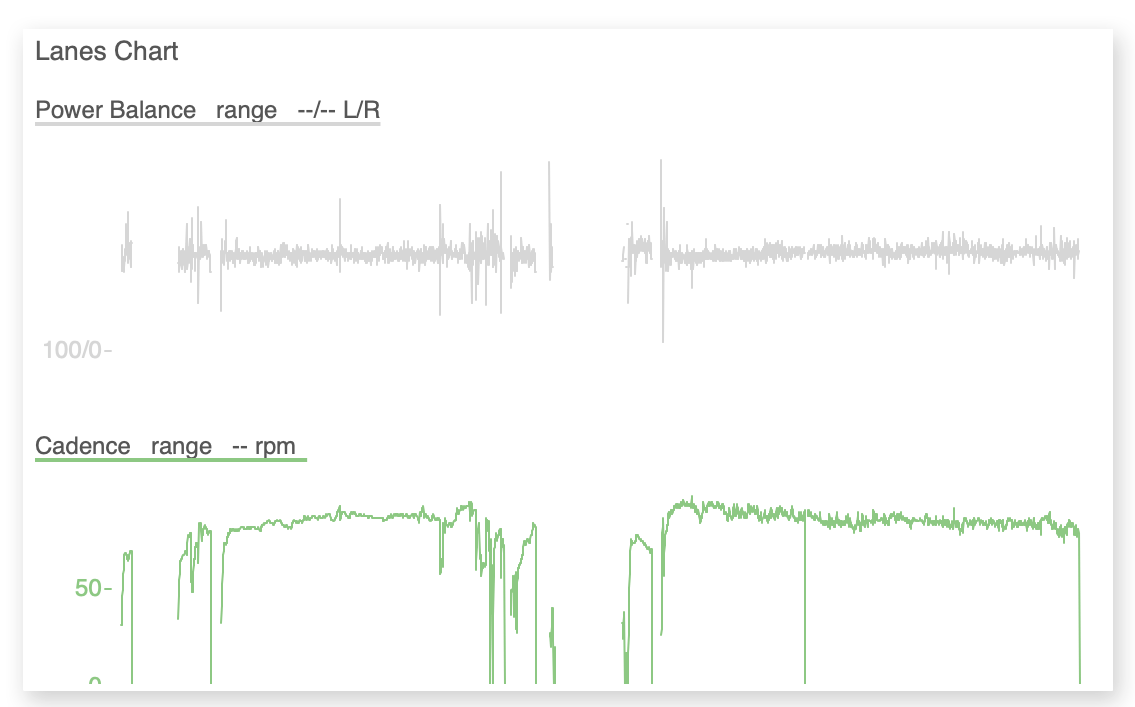
Lanes chart
The lanes chart displays all data channels in a workout, each one on its own separate axis and chart area; scroll down to view more channels. Use this chart as a visual list of workout data.
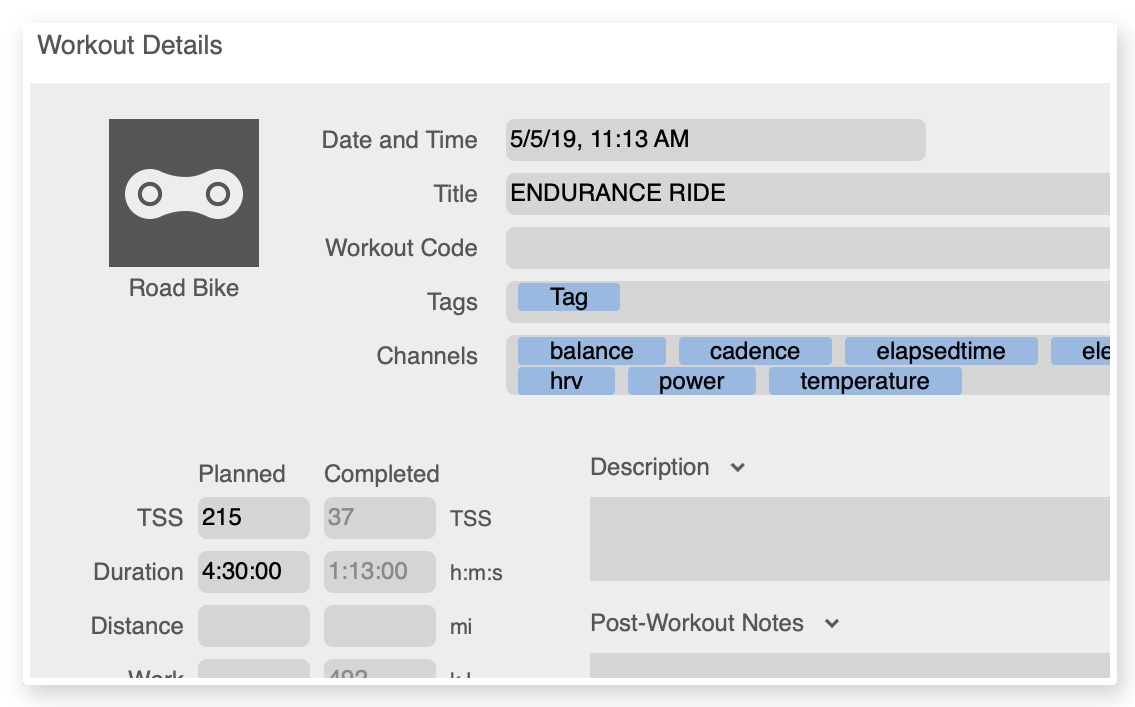
Workout details chart
The workout details chart is a copy of the details page that is always available in the workout navigation bar. Use this chart to edit workout information, review athlete notes, change the workout sport type, and review athlete metrics at the time of the workout.
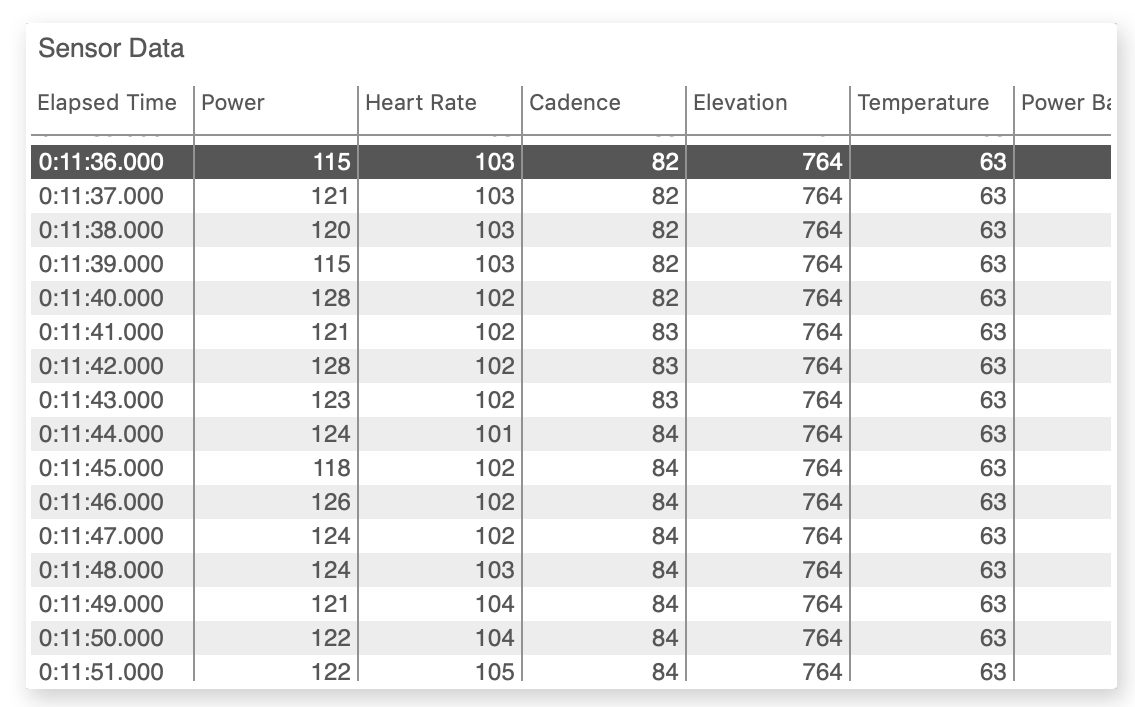
Sensor data chart
The sensor data chart displays all data recorded in the file at each recording point. Use this chart to edit data spikes and review point-by-point data.
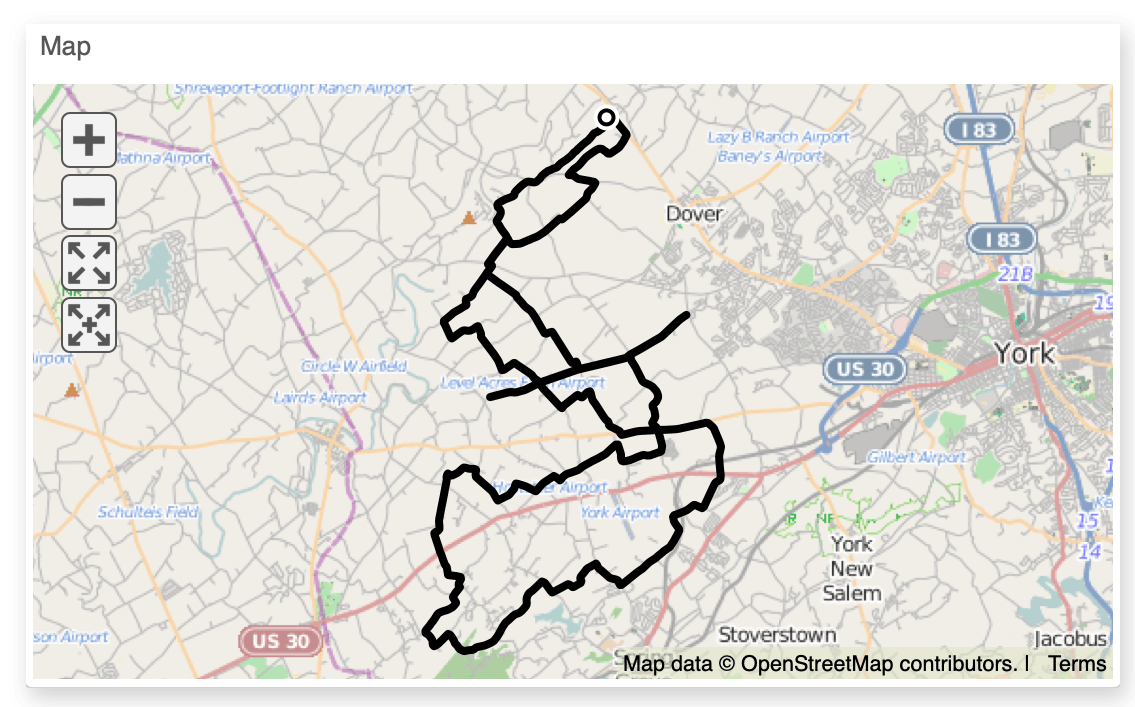
Map chart
The map chart displays the GPS data in a workout file. Use this chart to review the route taken in the workout.
Webpage chart
The webpage chart displays the webpage of your choice. Use this chart to view Internet information in real time.